Table 1: Staff response rate per health region
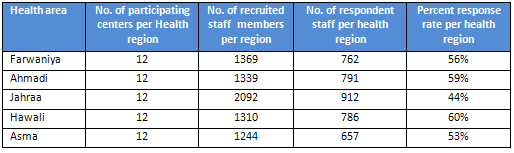
Descriptive
Statistics
Table 1: Staff response rate per health region
Table
2: Staff position respondent rate
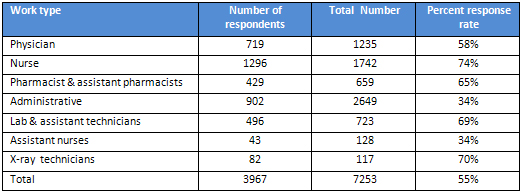
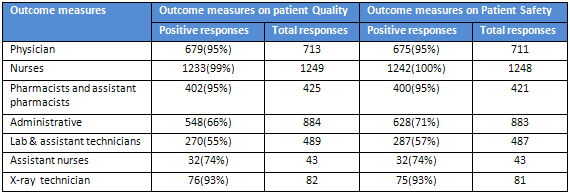
Table 3: Outcome measures on patient quality and safety
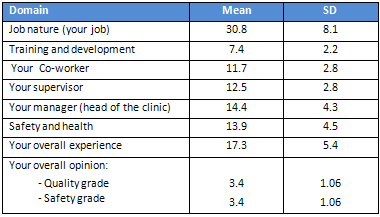
Table
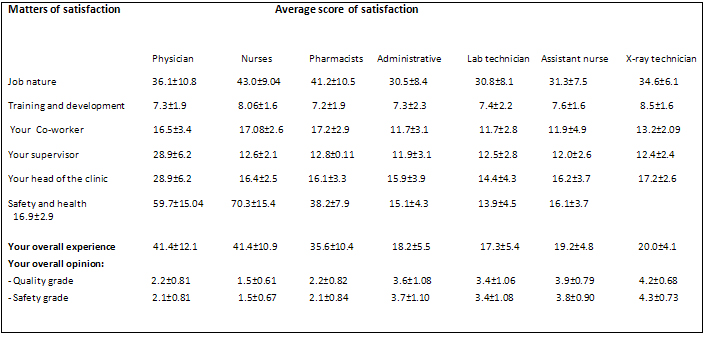
4: Mean of satisfaction in different domains for Physician (total 719)
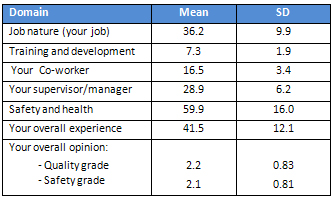
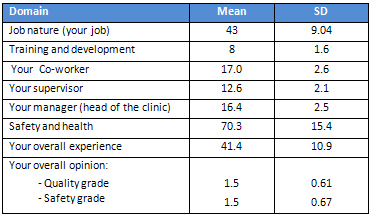
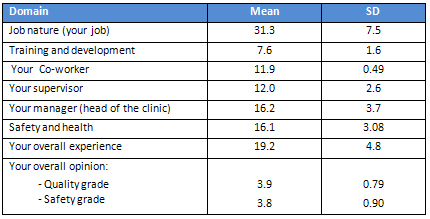
Table 5: Mean of satisfaction in different domains for Nurse (total 1296)
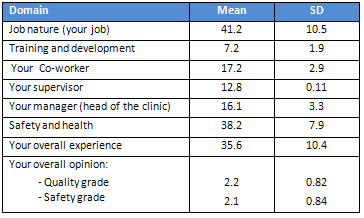
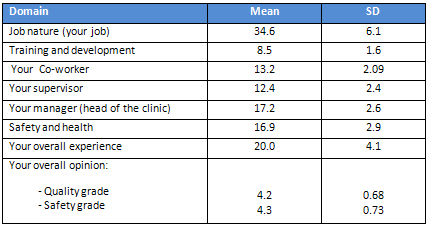
Table
6: Mean of satisfaction in different domains for pharmacist and assistant pharmacists
(total 429)
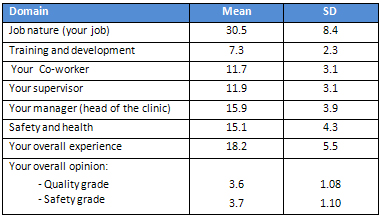
Table
7: Mean of satisfaction in different domains for administrative staff (total
902)
Table
8 : Mean of satisfaction in different domains for Lab Technician and Assistant
Lab Technician (total 496)
Table
9: Mean of satisfaction in different domains for Assistant nurse (total 43)
Table
10: Mean of satisfaction in different domains for X-ray technician (total 82)
Table
11: Comparing mean score of satisfaction for all staff