|
PowerPoint presentations
in Medical Conferences in Iraq. (A Qualitative
Study)
Ali A. Kadhim
Abutiheen
Correspondence:
Dr. Ali
A. Kadhim Abutiheen, M.B, Ch.B. - F.I.B.M.S.
(Consultant Family Physician)
Assistant Professor - Chairman
Family & Community Medicine Department
Kerbala University
College of Medicine
Iraq
Email: aliabutiheen@yahoo.com,
aliabutiheen@uokerbala.edu.iq
|
Abstract
Background:
PowerPoint (PPT) presentations are
the predominant kind of presentations
used in medical lectures, seminars and
conferences in recent years. Many physicians
and scientists are unaware of the rules
and guidelines in preparing and conducting
PPT presentations including many aspects
of it.
Objectives: To evaluate the state
of PowerPoint presentations and related
matters in Medical Conferences in Iraq.
Methods: This was a mixed qualitative
study, using observational approach. A
checklist prepared by the investigator,
was used to predict certain aspects in
presentations, presenters approach as
well as conference organization. Eight
conferences were included from 4 governorates
in Iraq for the period from November 2009
to December 2011. A total of 102 PowerPoint
presentations were included in the study.
Oral approval from the head of the conference
or organizing committee of the conferences
was taken prior to doing these observations.
Results: One out of the 8 conferences
starts on time with an average 30 minutes
delay. Thirty one (30%) of presenters
are facing problems, 43 (42%) use very
small size in some of their slides, 36
(35%) had mismatched colours. Fifty (49%)
used more than 15 lines per slides and
12 (12%) used more than 20 lines per slide.
Too many slides per presentation were
noticed with 28 and 37 using extra slides
and 19 using over animation in some slides.
Laser pointers were used by 39 of the
presenters, 13 (33%) of those used it
in a non-proper way, while 15 had delays
for 5 minutes and more. Side talks, mobile
rings and mobile talk were present in
more than 40% of presentations.
Conclusions and Recommendations:
Many problems were noticed with presentations
in medical conferences. Organizers need
to give more efforts toward logistics,
delays in time, presentation duration,
and assure a quiet environment. Presenters
should give consideration to their facing,
voice, pointer use as well as preparing
their PPT slides properly.
Key words: PowerPoint, PowerPoint
Presentation, Conference, Effective presentation,
Information and Communication Technology,
Iraq
|
Educational technology and audiovisual aids
had become an integral part of teaching, training
and giving lectures or presentations all over
the world (1-3). Technology and the term Information
and Communication Technology (ICT) are widely
used, and have become an essential element of
teaching environment in universities and institutes
(4-7).
PowerPoint (PPT) presentations are the predominant
kind of presentations used in medical lectures,
seminars and conferences in recent years as
well as in other sciences. Teachers and scientists
should know how to use ICT; even the general
population should know the proper use of it
in this era (1, 8-10). PPT can help in organizing
thoughts, time management and getting attention
and attraction of the audience. In addition,
most audiences like PPT presentations as they
can follow and remember the presentation (4,
7, 9, 11-13).
As any other technique or tool, PPT has some
weak points or disadvantages. Edward Tufte and
others have criticized PPT as being an evil
and the worst invention, for being teacher centered,
decreased thinking of the audience and other
issues (14-18). Though these limitations could
be related to the person constructing the PPT
slides or the presenter themmself not the program
(6, 17, 19-21). This argument might be usual
event with any invention.
Unfortunately, many presenters use PPT improperly;
thus it becomes distracting, dissociative and
decreases the effectiveness of the presentation,
instead of being additive and focused on the
presentation content. This could be related
to the fact that many physicians, teachers and
researchers are unaware of the rules and guidelines
of preparing and conducting PPT presentations
and slides, while others have little experience
with computers and programs or are not trained
on how to make an effective presentation (7,
22, 23).
Frequently presenters rely on the PPT, reading
slides from the laptops or screen, moving slides,
and thus losing communication and eye to eye
contact with the audience. Missing a basic rule
of facing in the audience's direction, not the
slides; he\she should be the focus of attention,
not the screen. PPT should add to his\her talk,
and deal with it as a supplement or an aid (20,
24-29).
An effective presentation should be interactive.
Success and productivity of a presentation depends
on presenters' ability, experience of how to
communicate with the audience, gain their attention
and use body languages efficiently, rather than
type and quality of the visual aids used (22,
26, 30).
Presenters' voices should be clear and audible
to all attendants while a soft monotonous voice
will negatively affect the presentation. Presenters
should speak at a suitable pace, not being fast
and should finish on time. To achieve that,
rehearsing and practicing will help, as well
as other issues related to presentation and
its effectiveness (8, 22, 26, 27, 30-33). Another
helpful rule in time management is "the
lesser number of slides in a presentation the
better" and do not use over two slides
per minute (34, 35). So for a 15 minutes presentation
your slides should not to exceed 30 while 20-25
slides, or even less, will be most suitable.
Designing of PPT slides is a major factor related
to the effectiveness of the presentation, and
the basic rules in preparing slides are:
- Keep simple design first and use a clear font.
- Use same design, fonts and colours for all
slides.
- Keep slides margins clear.
- Use small letters, it is easier to read and
writing in capital letters should be restricted
to titles or keywords.
- The lesser the words in a slide the better.
- Bigger size of font is better; size for titles
should be bigger than text.
- Suitable size for text is 30-36, and do not
use text size less than 24, even in small halls,
and many writers recommend larger size. (11,
19, 20, 25, 33, 35-41).
A common pitfall in preparing slides is putting
too many words in a slide. To overcome this
issue the rule of six or (6*6) should be followed.
This means that each slide should not contain
over six lines and each line should not contain
over six words. Some researchers refer to the
rule of seven, others recommend five lines,
but the majority agree that it should not exceed
eight lines per slide. Others advise a maximum
of twenty words per slide (8, 12, 20, 31, 35-37,
42).
Colour use in designing slides is liked by presenter
and audience, but too many colours are distracting.
Not more than 4 colours per slide is advised.
Select text colours to match with background
colour, and contrast with it. So use dark colours
on light background and light colours on dark
backgrounds. Avoid combination of colours as
it is difficult to read (35-37, 40).
I prefer a light background (light not shiny)
and dark text as it less affected by lighting
of the halls. Lighting of the hall is often
needed and asked for by media and photographers
covering conferences. Also keeping a little
lighting is better for communication as the
presenter can see the audience and it is advisable
to decrease sleepiness and eye fatigue (41).
Sleeping in conferences or lectures is not uncommon.
Special effects in PPT design such as animation
and sound effects could add to presentation
a touch of life or action. But overuse of them
are distracting and annoying (4, 8, 9, 17, 33,
35, 36, 38, 40, 43, 44). The same is true with
a laser pointer, which is frequently used by
many presenters, if its use is non proper or
unnecessary (22, 26).
Images are easier to understand and stay in
the mind of audience, but too many or nonrelated
images may distract the audience. However, avoid
using images as a background. Also graphs and
charts will be much easier to read than tables.
Tables are more suitable for publication than
presentation. Try to replace tables by graphs
whenever possible in PPT, but graphs should
be easy for visualization and understood. Use
of videos or any multimedia in presentation
can add and stay in the mind longer, as long
as it is it's related to the topic, and time
allocated is enough. (17, 19, 21, 25, 33, 40,
42, 45, 46).
After all remember that audiences are sitting
in the hall to watch and listen to your talk,
research notes, updates, thoughts and your experience
in the medical or other field, not to your experience
in PPT program techniques, animation, and use
of colours, or to see unrelated pictures or
shapes. And as you use technology and PPT you
should know how to deal with it, or at least
the ABC of that. Always be ready for alternative
ways to give the presentation if technology
fails you, or electricity goes off.
However, if circumstances forced you to give
a presentation, or for any reason you want the
audience not to understand your talk or open
discussion, you can use the opposite of above
mentioned PPT rules.
Many pitfalls and problems have been noted with
preparing PPT slides, audiovisuals use, giving
presentations, and in organization of the conferences
in Iraq. Issues that presenters or organization
committees miss or underestimate, may have negative
effects on attendants, outcomes of presentations
and the conference. So the objective of this
study was to evaluate the state of PPT presentations
and some related issues in medical conferences'
organization in Iraq.
This was a mixed qualitative research study,
using observational approach. The study included
8 medical conferences or symposia held in 4
different provinces in Iraq for the period from
November 2009 to December 2011; the organizers
of the conferences were different parties: Ministry
of Health, Ministry of Higher Education and
Scientific Research, Medical Societies and some
were cooperations between them. Selection of
the presentation was random, depending on sequences
of the presentation in the conference and the
availability of the investigator.
A special checklist was prepared by the investigator,
in order to predict certain aspects in PPT presentation,
the presenters' approach as well as conference
organizations while attending conferences, such
as: starting time of conference with schedule,
starting of sessions, time allocated for presentation,
the introduction of the presenters by chairs
of session (whether adequate or non-adequate
or not observed).
Issues related to the presenter included the
following: facing (good, accepted, non- accepted);
voice (good, accepted, non-accepted); font type
(clear, accepted, non-clear); Font size ( large
= read easily, small = difficult to read, very
small = very difficult or could not be read);
colours used (good = matched, accepted, non-
accepted = mismatched); too many colours (more
than 5/slides); number of lines per slide (?10,
11-15, 16-19, ? 20); use of pictures; tables
and graphs (not used, good, accepted, non-accepted=
very difficult or could not be recognized, not
observed); use of laser pointer in presentation,
any method of usage of it (good, accepted, misuse
or overuse "when its use is distracting
or over-moved in annoying way".
Also number of slides per presentation (good,
accepted, too many); extra-slides presence "slides
that were not presented or discussed and just
passed on by presenters"; Animation (good
or accepted, overuse, not observed); the pace
or speed of presenter (good, accepted, fast);
commitment with time (finish on time or before,
delay 2-3 minutes, delay for 5 minutes or more);
time notification (notified on time or not);
response to notification (did not respond, responded
positively, not good response).
Other issues checked include: presence of side
talks, mobile ringing, mobile talk, quality
and arrangement of audiovisuals, disruption
or interruption of the presentations, and discussion
time as well any specific related issues.
To conduct these observations an oral approval
from the head of conference or head of organizing
committee of the conferences was taken prior
to doing these observations. Also names of conferences
were kept hidden only for the researcher, and
even names of presenters and their background
not recorded. Observations were translated to
frequencies and percentages and data expressed
as tables or figures.
A
total
of
102
PPT
presentations
were
included
in
the
study
from
8
conferences
conducted
in
four
different
Iraqi
governorates.
Only
one
conference
(12.5%)
started
on
time
of
schedule
with
average
30
minutes
delay
and
one
started
after
2
hours,
while
nearly
one
third
of
presentations
had
some
problems
in
audiovisuals
or
lighting
of
the
conference
hall.
Ninety
seven
(95.1%)
presenters
were
introduced
in
a
good
to
accepted
way
by
the
chairs
of
sessions.
And
94
(92.2%)
of
them
greeted
or
thanked
the
chair
or
audience
before
starting
their
presentation.
However
6
(5.9%)
had
a
weak
or
monotonous
voice
as
shown
in
Table
1.
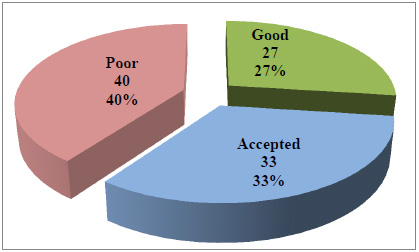
Also
facing
and
eye
contact
problems
with
attendants
were
noticed
with
31
(30.4%)
of
the
presenters
(Figure
1).
There
was
little
problem
with
type
of
font
used,
most
of
them
were
clear
and
readable,
and
only
1
(1%)
used
non-accepted
font.
While
92
(90.2%)
used
small
size
font
and
43
(42.2%)
used
very
small
size
in
some
of
the
slides
they
used.
Fifty
(49.2%)
used
more
than
15
lines
per
slide,
while
12
(11.8%)
used
more
than
20
lines
per
slide
in
some
of
their
slides
(Figure
2).
Too
many
slides
per
presentation
were
noted
with
28
(27.5%),
and
37
(36.3%)
used
extra
slides.
Regarding
colours,
36
(35.3%)
had
mismatched
colours
in
their
slides
while
10
(9.8%)
used
too
many
colours
in
some
slides,
and
30
(30%)
used
some
graphs
or
tables
that
were
difficult
to
be
seen
or
understood
(Figure
3)
Over
animation
was
noted
with
19
(18.6%)
of
presenters
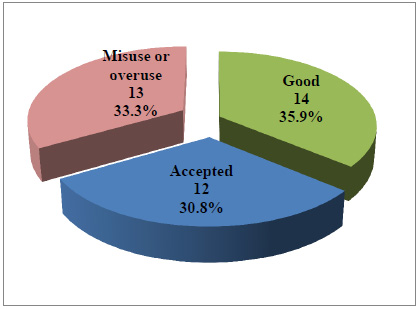
while
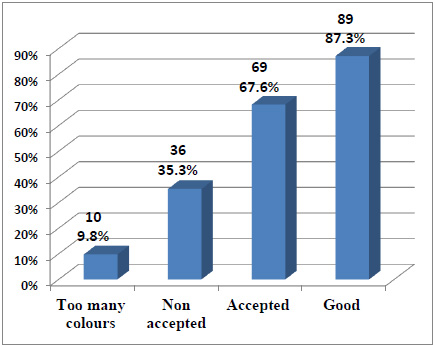
laser
pointers
were
used
by
39
(38.2%)
of
presenters;
of
those
13
(33.3%)
used
it
in
a
non-proper
way
or
unnecessarily
(Figure
4).
Nine
(8.8%)
of
presenters
were
fast
in
their
presentations
and
73
(71.6%)
finished
on
time
while
15
(14.7%)
delayed
for
5
minutes
and
more.
Forty
(39.2%)
presenters
were
notified
on
time,
and
7
(6.9%)
notified
for
more
than
one
time
after
time
was
exceeded.
However
the
response
for
notification
was
weak
in
13
(32.5%)
while
4
(10%)
ignored
time
notification.
Side
talks,
mobile
rings
and
mobile
talk
was
present
during
42
(41.2%)
presentations,
and
about
12
(11.8%)
presentations
were
interrupted,
and
in
most
cases
by
power
off
or
audiovisual
problems.
Table
1:
Frequency
and
Percentage
of
certain
attitudes
observed
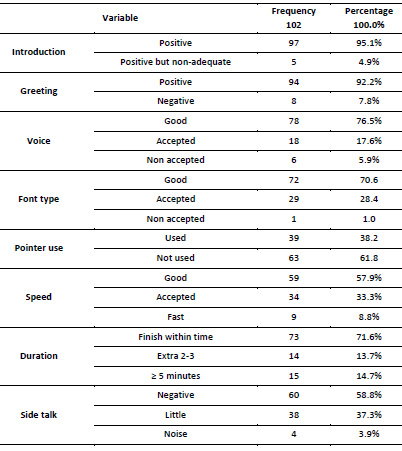
Figure
1:
Condition
of
Presenters
facing
the
audience
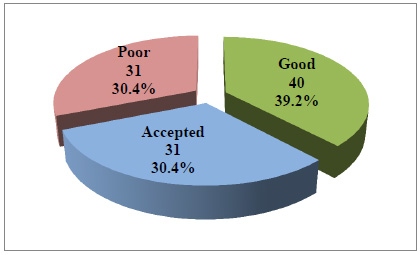
Figure
2:
Number
of
lines/slide
showed
by
presenters
in
some
of
their
slides
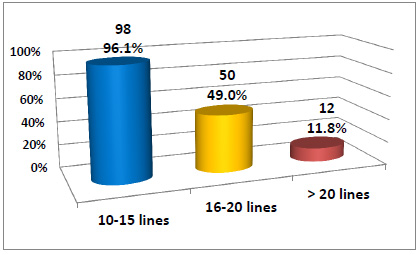
Figure
3:
Distribution
of
colours
used
in
slides
Figure
4:
Status
of
tables
and
graphs
presented.*(2
presentations
didn't
include
tables)
Figure
5:
Laser
pointer
usage
status.
PowerPoint
presentations
use
in
teaching,
learning
and
scientific
conferences
are
increasing
day
after
day.
Microsoft
in
2001
estimated
there
were
over
30
million
PPT
presentation
per
day,
so
imagine
the
number
nowadays(1,
28,
29).
Consider
Ian
Parker's
words
"appearing
in
meeting
nowadays
without
a
PPT
is
just
like
wearing
no
shoes"
(47).
So
researchers,
teachers,
scientists
should
have
competent
skills
on
how
to
prepare
a
PPT,
using
technology
fairly
and
giving
an
effective
presentation.
Each
of
these
areas
may
lead
to
bad
or
non-effective
presentations.
Also
they
can
be
boring
and
have
a
negative
impact
on
learning,
content,
attendance
and
retention
of
knowledge
(14,
17,
21,
28,
42,
48-50).
Delay
of
conferences
opening
was
quite
common
for
different
reasons.
But
a
common
reason
was
waiting
for
attendance
of
main
guests
such
as
ministers,
university
chancellor,
etc.,
who
usually
had
an
opening
speech.
Also
the
delay
was
present
in
most
lectures
sessions
openings.
However,
non-respect
to
time
could
be
a
social
problem
in
Iraq.
As
most
meetings
and
conferences
were
delayed
in
Iraq
up
to
the
highest
political
or
governmental
meetings
or
even
writing
the
Iraqi
Constitution.
Poor
preparedness
of
the
main
hall,
audiovisuals
and
computers
were
noted,
and
these
issues
had
negative
effects
on
presenters
and
materials.
Also
many
times
the
PPT
was
on
flash
ram
or
CD
and
not
on
main
computer,
and
had
not
been
tested.
Some
organizers
set
low
sited
datashows
that
were
affected
by
passing
of
guests
or
organizing
staff
in
front
of
the
screen.
Poor
facing
to
audience
was
present
in
nearly
one
third
of
presenters.
This
may
reflect
that
many
presenters
were
not
aware
or
had
not
considered
this
issue.
Though
sometimes
it
was
the
conference
organizers'
fault
who
did
not
put
a
laptop
or
screen
in
front
of
presenter.
This
mandated
the
presenter
to
read
from
the
screen
and
put
his/her
back
to
the
audience.
Some
presenters
were
smart
enough
to
try
to
overcome
this
situation
every
now
and
then
by
talking
to
audience,
while
others
kept
talking
without
any
consideration.
Another
problem
noticed,
was
that
the
slides
movement
was
not
done
by
the
presenters.
So
that
handicapped
the
presenter
and
required
them
to
tell
a
person
in
charge
to
move
slides
(next,
next..).
This
was
more
problematic
if
the
slides
were
not
organized,
if
they
wanted
to
go
back
to
a
certain
slide
and
if
there
were
extra
slides.
On
the
other
hand
some
presenters
had
very
little
experience
with
computers
or
PPT
programs
and
were
be
keen
for
someone
to
move
their
slides.
In
one
conference
there
was
a
laptop
in
front
of
presenters
but
the
show
was
from
another
computer
that
was
connected
to
a
datashow.
Though
they
offered
some
help,
it
was
confusing
for
presenter
as
well
as
audience.
As
in
most
conferences,
the
presenter
should
stand
in
an
almost
fixed,
static
area
that
gives
no
or
very
little
space
for
movement.
So
organizers
should
arrange
a
laptop
or
screen
in
front
of
them,
and
he\she
should
be
responsible
for
slides
transition,
and
presenters
should
know
how
to
do
it.
However,
an
important
issue
is
that
presenters
should
be
aware
and
care
about
facing
the
audience
as
well
as
using
effective
body
language.
The
use
of
remote
devices
in
presenters'
hands
would
be
very
helpful
supposing
that
presenters
are
familiar
with
the
use
of
them.
This
can
give
more
freedom
to
move
and
use
body
language.
Minor
problems
appeared
with
introduction
of
presenters
to
audience,
but
occasionally
it
wasn't
fair
enough.
Also
the
thanks
and
greetings
from
presenters
to
audience
and
chairmen
was
good.
Voice
problems
were
not
that
common
and
many
times
related
to
audio
devices
and
microphones.
But
more
voice
problems
were
noticed
in
discussion
sessions,
where
portable
microphones
were
poorly
functioning.
A
majority
use
small
size
font,
and
42%
used
very
small
size
font
that
was
difficult
to
be
read.
However
this
issue
is
directly
related
to
number
of
lines
used
per
slide,
as
49%
and
12%
had
used
slides
with
15-19
and
more
than
20
lines/
slide
respectively.
This
reflects
a
major
problem
that
is
very
awful
to
read,
if
one
can
read
it
in
the
first
place.
This
was
greatly
associated
with
tables
presented,
as
only
14%
of
tables
were
good.
So
presenters
should
reconsider
the
use
of
tables
in
their
presentation
or
use
suitable
graphs
instead
if
applicable.
Misuse
of
laser
pointer
was
noticed
with
one
third
of
its
users.
However
if
the
slides
were
prepared
according
to
PPT
slides
preparation
rules,
there
would
be
less
or
even
no
need
for
the
use
of
laser
pointer.
Instead
one
can
use
the
cursors
present
on
computer
keyboards
and
as
Jannette
Collins
explain
in
her
useful
article(26).
Big
numbers
of
slides
were
noticed
in
28%
of
presentations,
and
38%
included
some
extra
slides
or
unnecessary
slides,
that
not
been
shown
or
discussed.
Some
included
tens
of
these
slides.
This
reflects
poor
preparation,
poor
time
management,
no
consideration
for
time
allocation
for
each
slide
and
even
no
review
of
PPT,
or
rehearsal.
Good
colour
match
was
the
predominant
feature,
however
non-accepted
or
poorly
matched
colours
appeared
in
nearly
one
third
of
presentations.
On
other
hand
10%
of
presenters
used
too
many
colours
in
one
slide
or
more.
This
could
be
related
to
unawareness
of
colours
matching
issue,
or
they
thought
that
shining
and
frequent
colours
added
to
PPT,
while
the
reverse
could
happen.
Similar
explanations
could
account
for
use
of
over
animation
that
was
present
in
nearly
one
fifth
of
presentations.
We
believe
that
10
minute
presentations,
that
were
the
most
prevalent
duration
given,
is
not
a
fair
time
to
give
for
a
research
presentation
or
an
update.
Duration
of
15-20
minutes
is
more
suitable,
or
should
be
the
minimum
time
to
be
given.
Moreover,
when
being
beyond
time
for
any
reason,
the
chairperson
tends
to,
or
been
asked
to
reduce
time
allocated
on
the
schedule
for
even
less
than
10
minutes.
Short
duration
increased
the
act
of
giving
fast
presentation
that
is
a
non
preferred
event,
even
if
it
appeared
only
in
9%
of
presentations.
Going
fast
was
also
affected
by
bulk
of
data
presented,
big
number
of
slides,
and
running
out
of
time.
Short
duration
given
could
give
a
hint
as
to
why
some
presenters
exceeded
time
given
for
them.
But
definitely
it
was
not
the
only
excuse
as
15%
exceeded
5
minute
delays,
while
others
took
more
than
double
the
time
and
ignored
the
recurrent
notifications
on
time.
Side
talks
and
mobile
rings
lead
to
distraction
and
non-calm
or
noisy
environment
and
it
was
present
in
more
than
40%
of
presentations.
Mobile
rings
were
heard
not
only
from
audience,
but
sometimes
from
the
presenters
themselves
and
even
from
the
chair
committee
who
sometimes
had
side
talks.
Furthermore
some
chairpersons,
were
not
monitoring
time,
leaving
presenters
to
exceed
time
allocated
for
them;
that
is
a
major
responsibility
for
a
chair
person.
Interruption
of
presentation
was
another
unpleasant
event
and
unfortunately
it
was
present
in
nearly
10%
of
presentations
though
electricity
going
off,
which
is
a
common
event
in
Iraq
was
the
main
cause.
Sometimes
the
cause
was
related
to
audio-visuals
malfunction
and
weak
preparedness
of
the
organizing
committee.
The
fact
that
only
one
person
evaluated
the
presentations,
is
one
of
the
limitation
of
this
study.
But
it
could
be
a
strength
also,
as
multiple
observers
would
have
different
standards
and
ranking.
After
all
the
study
aims
to
highlight
the
issue,
to
try
to
raise
standards
of
PPT
presentation
design,
conference
organization,
and
effective
lecturing.
Another
limitation
was
the
general
difficulty
of
recording
observations
while
attending
an
event,
as
we
are
humans
and
we
cannot
record
all
observations.
Presenters
in
these
conferences
were
from
all
over
Iraq,
and
many
of
them
were
not
physicians.
So
what
appeared
in
these
medical
conferences
can
be
applied
to
scientific
conferences
in
other
fields,
and
actually
same
issues
noticed
in
them
out
of
this
study.
In
conclusion,
there
are
many
pitfalls
with
presentations
in
medical
conferences
in
Iraq.
Medical
colleges,
conferences'
organizers
and
medical
personnel
need
to
give
more
efforts
for
PPT
slides
preparation
based
on
specific
rules.
Also
they
need
to
consider
time
delay,
duration
given
for
presenters,
logistics,
conference
hall
preparation,
selection
and
role
of
chair
persons
and
to
assure
a
quiet
environment.
Presenters
should
give
consideration
to
their
facing,
voice,
pointer
use
as
well
as
their
slide
preparation
as
well
as
skills
in
giving
an
effective
presentation.
Further
studies
on
this
area
and
issues
are
recommended.
1.
Savoy
A,
Proctor
RW,
Salvendy
G.
Information
retention
from
PowerPoint
and
traditional
lectures.
Computers
&
Education.
2009;52:858-67.
2.
Shu'aibu
B,
Bappah
AS,
Saud
MSB.
Modelling
ICT
Integration
in
Teaching
and
Learning
of
Technical
Education.
Journal
of
Social
Sciences.
2013;9(2):81-8.
3.
Littlefield
MB,
Rubinstein
K,
Pittman
ME.
Beyond
PowerPoint™:
Using
Learning
Objects
to
Enhance
Social
Work
Courses.
Journal
of
Technology
in
Human
Services.
2015;33(2):172-90.
4.
Can
AV,
Karaca
N,
Akyel
N,
Demirci
SD.
Evaluating
the
Fitness
of
Lecturing
with
Powerpoint
Presentations
for
Accounting
Education-
Research
at
Sakarya
University-.
Procedia
-
Social
and
Behavioral
Sciences.
2012;55:128
-
37.
5.
Raman
R,
Pramod
D,
Bharathi
V.
Information
and
Communication
Technology
Based
Model
for
Dematerialization
of
Academic
Certificates
for
Indian
Educational
System.
American
Journal
of
Applied
Sciences.
2014;11(1):85-8.
6.
Kosslyn
SM,
Kievit
RA,
Russell
AG,
Shephard
JM.
PowerPoint
Presentation
Flaws
and
Failures:
A
Psychological
Analysis.
Frontiers
in
Psychology.
2012;3:230.
PubMed
PMID:
PMC3398435.
7.
Liu
X,
Xu
Y,
Pange
J.
Teachers'
use
of
PowerPoint
in
kindergarten:
An
empirical
investigation
in
China.
Education
and
Information
Technologies.
2016;21(2):425-41.
8.
Hashemi
M,
Azizinezhad
M,
Farokhi
M.
Power
Point
as
an
innovative
tool
for
teaching
and
learning
in
modern
classes.
Procedia
-
Social
and
Behavioral
Sciences.
2012;31:559
-
63.
9.
Kahraman
S,
Çevik
C,
Kodan
H.
Investigation
of
university
students'
attitude
toward
the
use
of
powerpoint
according
to
some
variables.
Procedia
Computer
Science.
2011;3:1341-7.
10.
MOKHTAR
AE,
ELMUSTAFA
SDA.
Evaluation
of
Power
Point
Presentation
Reflection
Among
Students
of
Applied
Medical
Sciences
College,
Najran
University.
The
FASEB
Journal.
2016;30(1
Supplement):785.20.
11.
Uz
Ç,
Orhan
F,
Bilgiç
G.
Prospective
teachers'
opinions
on
the
value
of
PowerPoint
presentations
in
lecturing.
Procedia
Social
and
Behavioral
Sciences.
2010;2:2051-9.
12.
Wecker
C.
Slide
presentations
as
speech
suppressors:
When
and
why
learners
miss
oral
information.
Computers
&
Education.
2012;59:260-73.
13.
Akhlaghi
M,
Zareian
G.
The
Effect
of
PowerPoint
Presentation
on
Grammar
and
Vocabulary
Learning
of
Iranian
Pre-University
EFL
Learners.
Academic
Research
International.
2015;6(1):160.
14.
Tufte
ER.
The
cognitive
style
of
PowerPoint:
Graphics
Press
Cheshire,
CT;
2003.
15.
Tufte
ER.
PowerPoint
is
Evil.
PowerPoint
Corrupts.
PowerPoint
Corrupts
Absolutely.
Wired
Magazine.
2003;11(9):118-9.
16.
Taylor
D.
Death
by
PowerPoint.
Developmental
Medicine
&
Child
Neurology.
2007;49(5):395-.
18.
Thompson
C.
PowerPoint
makes
you
dumb.
New
York
Times,
December.
2003;14.
19.
Barnes
J,
Patterson
B.
A
Necessary
Evil:
Edward
Tufte
and
Making
the
Best
of
PowerPoint.
American
Society
of
Trial
Consultants,
The
Jury
Expert.
2011;23(6).
20.
Holmes
N.
The
Profession:
In
Defense
of
PowerPoint.
Computer.
2004:89-100.
21.
Penciner
R.
Does
PowerPoint
enhance
learning?
CJEM.
2013;15(2):109-12.
22.
Hawker
CJ.
Editorial:
Effective
Presentations-A
Must.
Angewandte
Chemie
International
Edition.
2013;52(14):3780-1.
23.
Kollar
J,
Babusa
B,
Stauder
A,
Pilling
J,
Cserepes
R,
Czeglédi
E.
Improving
teaching
efficiency
on
Medical
Universities
-
A
comparative
study
of
Hungarian
and
foreign
medical
university
students'
feedbacks
regarding
learning
by
KOLLAR
method.
J
Contemp
Med
Edu.
2016;4(1):1-7.
24.
Stein
K.
The
Dos
and
Don'ts
of
PowerPoint
Presentations.
Journal
of
the
American
Dietetic
Association.
2006:1745.
25.
Roos
D,
Toothman
J.
10
Tips
for
More
Effective
PowerPoint
Presentations
2008.
Available
from:
http://money.howstuffworks.com/business-communications/effective-powerpoint-presentations.htm.
26.
Collins
J.
Education
Techniques
for
Lifelong
Learning\
Giving
a
PowerPoint
Presentation:
The
Art
of
Communicating
Effectively.
RadioGraphics.
2004;24(4):1185-92.
27.
Bourne
PE.
Ten
Simple
Rules
for
Making
Good
Oral
Presentations.
PLoS
Computational
Biology.
2007;3(4):0593-4.
28.
Pros
RC,
Tarrida
AC,
Martin
MdMB,
Amores
MdCC.
Effects
of
the
PowerPoint
methodology
on
content
learning.
Intangible
Capital.
2013;9(1):184-98.
29.
Craig
RJ,
Amernic
JH.
PowerPoint
Presentation
Technology
and
the
Dynamics
of
Teaching.
Innov
High
Educ.
2006;31:147-60.
30.
Pourfarhad
M,
Azmey
FLA,
Hassani
L.
Perceptions
of
International
Students
on
Academic
Literacy
Focusing
on
Speaking
and
Listening
Skills
in
Malaysia.
Procedia
-
Social
and
Behavioral
Sciences.
2012;69:197-205.
31.
Blokzijl
W,
Andeweg
B,
editors.
The
Effects
of
Text
Slide
Format
and
Presentational
Quality
on
Learning
in
College
Lectures.
IEEE
International
Professional
Communication
Conference;
2005:
IEEE.
32.
Alexandrov
AV,
Hennerici
MG.
How
to
Prepare
and
Deliver
a
Scientific
Presentation.
Cerebrovascular
Diseases
2013;35(3):202-8
33.
Fathalla
MF,
editor.
A
Practical
Guide
for
Health
Researchers.
Cairo:
WHO
Regional
Publications
Eastern
Mediterranean
Series
30;
2004.
34.
Castillo
M.
Making
a
Point:
Getting
the
Most
Out
of
PowerPoint.
AJNR
Am
J
Neuroradiol.
2011
(32):217-20.
35.
O'Neil
S.
PowerPoint
Presentation
Dos
&
Don'ts:
Steve
O'Neil;
2005
[27-9-2013].
36.
Collins
J.
Education
Techniques
for
Lifelong
Learning
-
Making
a
PowerPoint
Presentation.
RadioGraphics.
2004;24(4):1177-83.
37.
Durso
FT,
Pop
VL,
Burnett
JS,
Stearman
EJ.
Evidence-Based
Human
Factors
Guidelines
for
PowerPoint
Presentations.
Ergonomics
in
Design.
2011;19(4):4-8.
38.
Brodsky
D,
Doherty
EG.
Educational
Perspectives:
Creating
an
Effective
PowerPoint
Presentation.
Neoreviews
[Internet].
2011;
12(e687).
Available
from:
http://neoreviews.aappublications.org/content/12/12/e687.
39.
Garner
JK.
Rethinking
the
Design
of
Presentation
Slides:
An
Evidence
Based
Approach
2013.
Available
from:
http://www.teachingkb.cidde.pitt.edu/wp-content/uploads/2014/04/Garner_Handout_SIDI_2013.pdf.
40.
Berk
RA.
Top
10
Evidence-Based,
Best
Practices
for
PowerPoint®
in
the
Classroom.
Transformative
Dialogues:
Teaching
&
Learning
Journal.
2012;5(3):1-7.
41.
Jones
AM.
The
use
and
abuse
of
PowerPoint
in
Teaching
and
Learning
in
the
Life
Sciences:
A
Personal
Overview.
Bioscience
Education.
2003;2(1):1-13.
42.
Cho
YH,
Lee
SE.
The
role
of
co-explanation
and
self-explanation
in
learning
from
design
examples
of
PowerPoint
presentation
slides.
Computers
&
Education.
2013;69:400-7.
43.
Berk
RA.
How
to
Create
"Thriller"
PowerPoints®
in
the
Classroom.
Innov
High
Educ.
2012;37:141-52.
44.
Singh
D,
Omar
R,
Anuar
A.
Low
Cost
Interactive
Electronic
Whiteboard
Using
Nintendo
Wii
Remote.
American
Journal
of
Applied
Sciences.
2010;7(11):1458-63.
45.
Kelleher
C,
Wagener
T.
Ten
guidelines
for
effective
data
visualization
in
scientific
publications.
Environmental
Modelling
&
Software.
2011;26:822-7.
46.
Brock
S,
Joglekar
Y.
Empowering
PowerPoint:
Slides
and
teaching
effectiveness.
Interdisciplinary
Journal
of
Information,
Knowledge,
and
Management.
2011;6(1):85-94.
47.
Parker
I.
Absolute
PowerPoint:
Can
a
software
package
edit
our
thoughts.
The
New
Yorker
28
May
2001:76-87.
48.
Dawson
V,
Forster
P,
Reid
D.
Information
Communication
Technology
(ICT)
Integration
in
a
Science
Education
Unit
for
Preservice
Science
Teachers;
Students'
Perceptions
of
Their
ICT
Skills,
Knowledge
and
Pedagogy.
International
Journal
of
Science
and
Mathematics
Education.
2006;4(2):345-63.
49.
Berk
RA.
Research
on
PowerPoint®:
From
basic
features
to
multimedia.
International
Journal
of
Technology
in
Teaching
and
Learning.
2011;7(1):24-35.
50.
Chopra
J,
Rani
A,
Rani
A,
Deewan
R,
Srivastava
A,
Sharma
P.
Students'
Reflections
on
Teaching
Methodology
in
Anatomy.
Asian
Journal
of
Medical
Sciences.
2013;5(1):47-51
|