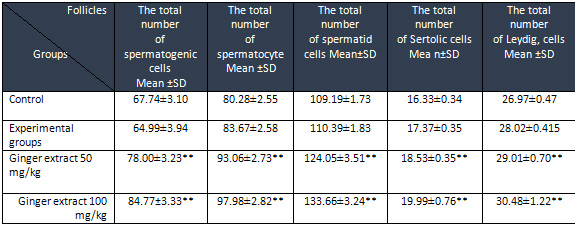
* Shows significant difference in level (P <0.05) in comparison to control
** Shows significant difference in level (P <0.01) in comparison to control
Table 2: the number of lineage sex cells in the groups treated with HEG in comparison to control
* Shows significant difference
in level (P <0.05) in comparison to control
** Shows significant difference in level (P <0.01) in comparison to control